


A good marketing dashboard fits on one page and answers one question: is marketing producing the revenue it should, and where should we spend next? In Looker Studio (formerly Data Studio) you can build that page for free by connecting GA4, Google Search Console, Google Ads and a sheet or CRM export of leads and revenue.
The ten numbers worth showing
- Leads this month vs. last month and the same month last year.
- Qualified leads, as defined with sales.
- Won deals and revenue from marketing-sourced leads.
- Cost per qualified lead by channel.
- Ad spend vs. budget.
- Organic search clicks and impressions (Search Console).
- Top landing pages by conversions.
- Google Business Profile calls and direction requests.
- First-response time to new leads.
- AI assistant referrals, as a separate channel.
| Number | Source | Question it answers |
|---|---|---|
| Leads by source | CRM | Where is demand coming from? |
| Qualified leads | CRM | Is the demand any good? |
| Cost per qualified lead | Ads + CRM | Are we paying a sane price? |
| Pipeline created | CRM | Will next quarter be okay? |
| Revenue closed by source | CRM | What actually paid off? |
| Speed to lead | CRM | Are we wasting the leads we pay for? |
| Organic clicks | Search Console | Is search visibility growing? |
| Branded search impressions | Search Console | Is the brand growing? |
| Conversion rate on key pages | GA4 | Is the site doing its job? |
| Ad spend vs plan | Ad platforms | Are we on budget? |
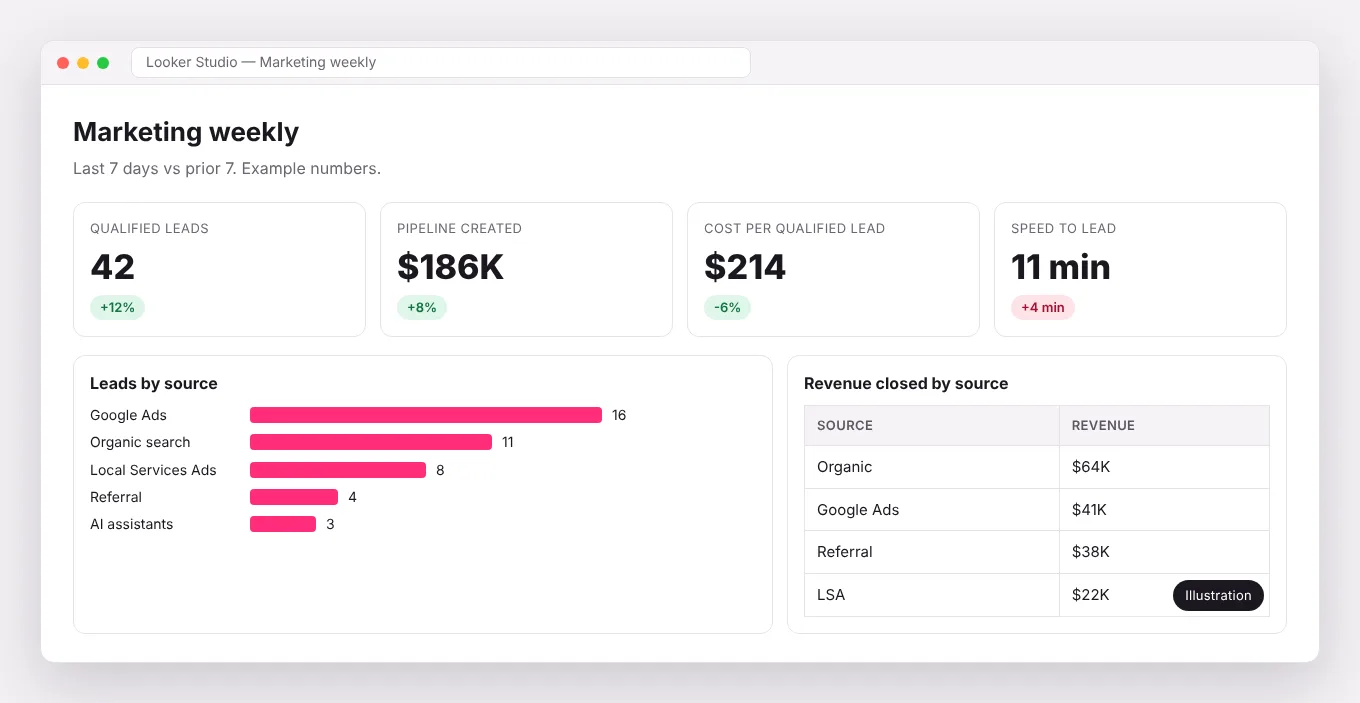
Design rules that keep it readable
- One page. If it needs scrolling, it needs cutting.
- Scorecards with comparisons at the top, trends in the middle, detail at the bottom.
- Label every metric in plain words and define it in a footnote.
- Use one color for good and one for bad, consistently.
- Add date controls so the owner can change the period without breaking anything.
Connecting the data
Use the native GA4, Search Console and Google Ads connectors. For leads and revenue, export from your CRM to a Google Sheet on a schedule, or use a connector for HubSpot or Salesforce. Blend sources on date and channel. Keep the data model simple; complex blends are where dashboards break.
Make it a habit
A dashboard nobody reviews is decoration. Put a 20-minute weekly review on the calendar, look at the same ten numbers every time, and write down one decision. That habit matters more than any chart.
Frequently asked questions
Is Looker Studio free?
Yes. Some third-party connectors charge a fee, and Looker Studio Pro adds team features, but the core tool is free.
Can Looker Studio pull from HubSpot?
Through partner connectors or a scheduled sheet export. The sheet approach is cheaper and easier to maintain for small teams.
We build these dashboards as part of every strategy and CRM engagement, and they are yours to keep.