


ROAS (return on ad spend) measures how much revenue your advertising brought in for every dollar you spent on ads. ROI (return on investment) measures how much profit the business made on everything it invested, after all costs. ROAS answers "are these ads producing sales?" ROI answers "did we actually make money?"
The two get mixed up constantly, in dashboards, in agency reports and in board meetings. That confusion is expensive, because the number that looks great in an ad platform is often not the number that pays the bills.
What is ROAS?
ROAS is a revenue ratio. Divide the revenue attributed to your ads by what you spent on those ads. If you spend $5,000 on Google Ads and the platform credits $20,000 in sales, your ROAS is 4, often written 4× or 400%.
ROAS is fast and easy, which is why every ad platform reports it. It is also blind to everything that happens after the sale: what the product cost you, shipping, payment fees, returns, the agency, the software and your own time.
What is ROI?
ROI is a profit ratio. Take the profit an investment produced, subtract what you invested, and divide by what you invested. If a campaign cost $10,000 all in and produced $14,000 in gross profit, ROI is ($14,000 − $10,000) ÷ $10,000 = 40%.
ROI is slower to calculate because it needs numbers from outside the ad platform: margins from finance, closed revenue from the CRM and every cost of running the program. That extra work is exactly what makes it honest.
ROI vs ROAS side by side
| ROAS | ROI | |
|---|---|---|
| Formula | Ad revenue ÷ ad spend | (Profit − total investment) ÷ total investment |
| Measures | Revenue efficiency of ads | Profitability of the whole investment |
| Costs included | Ad spend only | Ad spend, product cost, fees, people, tools, agency |
| Typical format | 4× or 400% | 40% |
| Where it lives | Google Ads, Meta, Amazon dashboards | Finance and CRM reporting |
| Best for | Optimizing campaigns, bids and creative | Budget decisions and channel strategy |
| Main blind spot | Margins and every non-ad cost | Slow; needs clean data from several systems |
A worked example: when 4× ROAS loses money
Here is the math on one month of an ecommerce campaign. The ad platform shows a healthy 4× ROAS. The full picture tells a different story.
| Line | Amount | Note |
|---|---|---|
| Ad spend | $5,000 | What the platform counts |
| Revenue credited to ads | $20,000 | ROAS = 4.0× |
| Cost of goods (60%) | −$12,000 | Product cost at a 40% gross margin |
| Shipping and payment fees | −$1,800 | About 9% of revenue |
| Agency and tools | −$2,500 | Management fee and software |
| Profit after ad spend | −$1,300 | Revenue − COGS − fees − agency − ad spend |
| ROI | −17% | −$1,300 ÷ $7,500 invested (ads + agency and tools) |
What is a good ROAS?
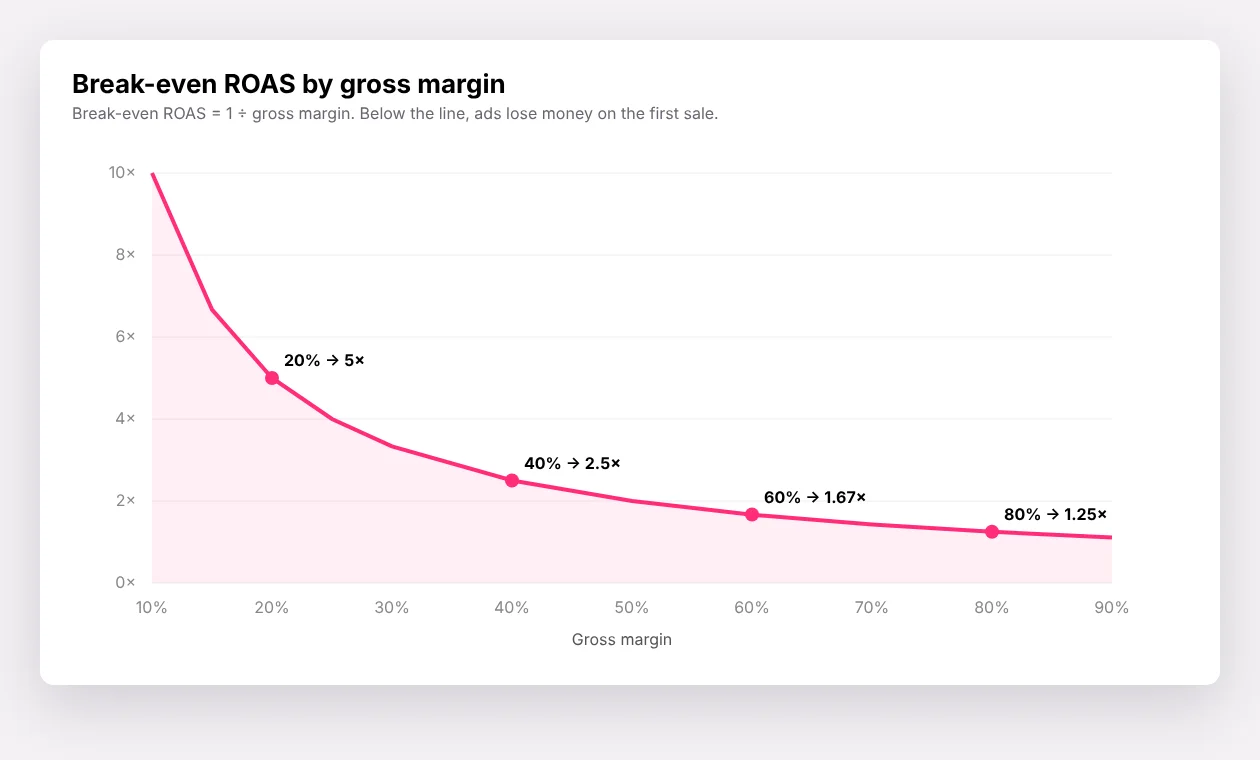
A good ROAS is one above your break-even point, and break-even depends on your margin. Break-even ROAS = 1 ÷ gross margin. At a 40% margin you need 2.5× just to cover product costs, before fees and people. At an 80% margin (common in software and services), 1.25× covers it.
| Gross margin | Break-even ROAS | What it means |
|---|---|---|
| 20% | 5.0× | Thin-margin retail needs very efficient ads |
| 40% | 2.5× | Typical for many physical products |
| 60% | 1.7× | Premium products and many services |
| 80% | 1.25× | Software, digital products, high-margin services |
When should you use ROAS, and when ROI?
- Use ROAS daily and weekly to compare campaigns, ad sets and creative inside one platform.
- Use ROI monthly and quarterly to decide which channels get more budget, and whether marketing as a whole is paying off.
- Use ROI for anything with a long sales cycle. Lead generation businesses should measure revenue from closed deals in the CRM, not form fills.
- Use lifetime value with ROI when customers buy again. A first-order ROAS below break-even can still be profitable over a customer's life.
Common mistakes
- Comparing ROAS across platforms. Each platform credits itself, so Google and Meta often both claim the same sale.
- Reporting ROAS without a margin. A ROAS target means nothing until you know your break-even.
- Calling ROAS "ROI" in a board deck. They are different numbers, and finance will notice.
- Ignoring repeat purchases. One-time ROAS undervalues channels that bring in loyal customers.
Frequently asked questions
Is ROAS the same as ROI?
No. ROAS divides ad revenue by ad spend. ROI divides profit, after all costs, by the total investment. A campaign can have a high ROAS and a negative ROI.
How do I calculate ROAS?
Divide revenue attributed to your ads by your ad spend. $20,000 in revenue on $5,000 of spend is a 4× ROAS.
How do I calculate marketing ROI?
Subtract your total investment (ads, agency, tools, people) from the gross profit the program produced, then divide by the total investment. Multiply by 100 for a percentage.
What is a good ROAS for Google Ads?
There is no universal number. A good ROAS is comfortably above your break-even ROAS, which is 1 divided by your gross margin.
Want your own break-even number? Try our free break-even ROAS calculator, or book a Numbers Call and we will work through your real margins and acquisition costs together.